THE ECONOMIST : PROPENSITY TO BUY
NOVEMBER 2018

A data product proof of concept looking to tell consumer industry professionals how likely consumers are to buy their products at a city level in hard to reach emerging markets.
01 / Summary
What was delivered and how?
Team
Product team
Product manager
Lead product designer
Lead modelling economist
Cities data modelling economist
Lead engineer
Backend engineer
Front-end engineer
Business analyst
Project manager
QA tester
Steering committee
Head of Marketing
Head of Editorial
Head of Digital
What I did
Customer profiling
Wireframing
Prototyping
Data visualisation
UI design
Handoff
QA
Deliverables
Personas
User journey mapping and flows
Data visualisation
Clickable prototype
Detailed designs
Impact
Over six months, the team researched the market, developed the idea, sourced and modeled data, and tested a proof of concept. This work transformed EIU’s data collection, inspiring innovative new data products.
02 / Finding the value proposition
In April 2018, the Economist Intelligence Unit saw an opportunity to create a product for consumer industries to gauge city-level interest in emerging markets. Initial research focused on food and retail. The project PM and I interviewed firms like Godiva, Kellogg, Mars Wrigley, McDonald's China, PepsiCo, Red Bull, and Unilever to understand unmet needs and position EIU’s offering. Companies typically relied on imprecise, combined data, admitting “a bad guess is better than no guess.” Our solution used proprietary survey data with income and demographic info to model product demand by city, providing strategists a more accurate, reliable platform to assess consumer willingness to buy.
03/ Customer profiling
Using research interviews, I created a customer profile starting with a workshop involving a cross-functional Economist team. We mapped the current and aspirational customer journeys for a consumer business entering new markets. Focusing on the strategy team, we identified two key roles: Steerers, who influence decisions without deep data analysis, and Informers, who analyse data patterns to understand buying behaviour. Each role uses data differently—Informers uncover insights, while Steerers use headline info to guide decisions.
Personas
04 / Starting with data
The solution design began by collaborating with the data team to envision the service, then working backward to identify required data, modelling methods, and collection strategies.
From our initial discussions we were expecting to be able to get to 2 key numbers:
the propensity to buy score as a percentage e.g. 34% of consumers will buy chocolate in city X.
and
the market size e.g. (34% propensity to buy is equal to) 2.4 million consumers in city X.
Research showed the second figure, the "size of the prize," mattered most to consumer companies. Forecasting these numbers was essential, with longer outlooks preferred. We chose a 5-year forecast.
Beyond the big numbers, we aimed to help businesses build customer profiles using demographics (age, gender, income) and purchase behaviors. We agreed on three key data points: purchase frequency, purpose, and channel.
The final data piece represented consumers' attitudes toward health, fitness, technology, and lifestyle. Research showed companies also seek indicators beyond purchase behavior, such as home ownership, credit card and mobile payment use, and exercise routines. We aimed to capture relevant data on these for our model.
We chose four markets for data collection: Bangkok, Ho Chi Minh City, Johor Bahru, and Jakarta.
Two data collection methods were compared: a traditional consumer survey company and Streetbees, a tech startup using AI and geolocation via a mobile app. These approaches provided different outputs for later comparison to determine effectiveness and commercial viability.
05 / Design sprint
As the data team began the collection and modelling of the survey data, I started on the page designs.
I ran a design sprint over a week with the product team where we were able to explore the problem space from all angles, brainstorm ideas, converge on the strongest ideas and then prototype and test internally.
We ended up with 4 main views in the tool. These were:
a data summary page giving headline numbers for each city
an individual city data deep dive giving a full breakdown of the data
a data explorer, to allow for an analyst to dig into the data
supporting country analysis to give deeper background and supporting analysis
From this point I was then able to start to think about the tool from a holistic level and map out the service and its key flows.


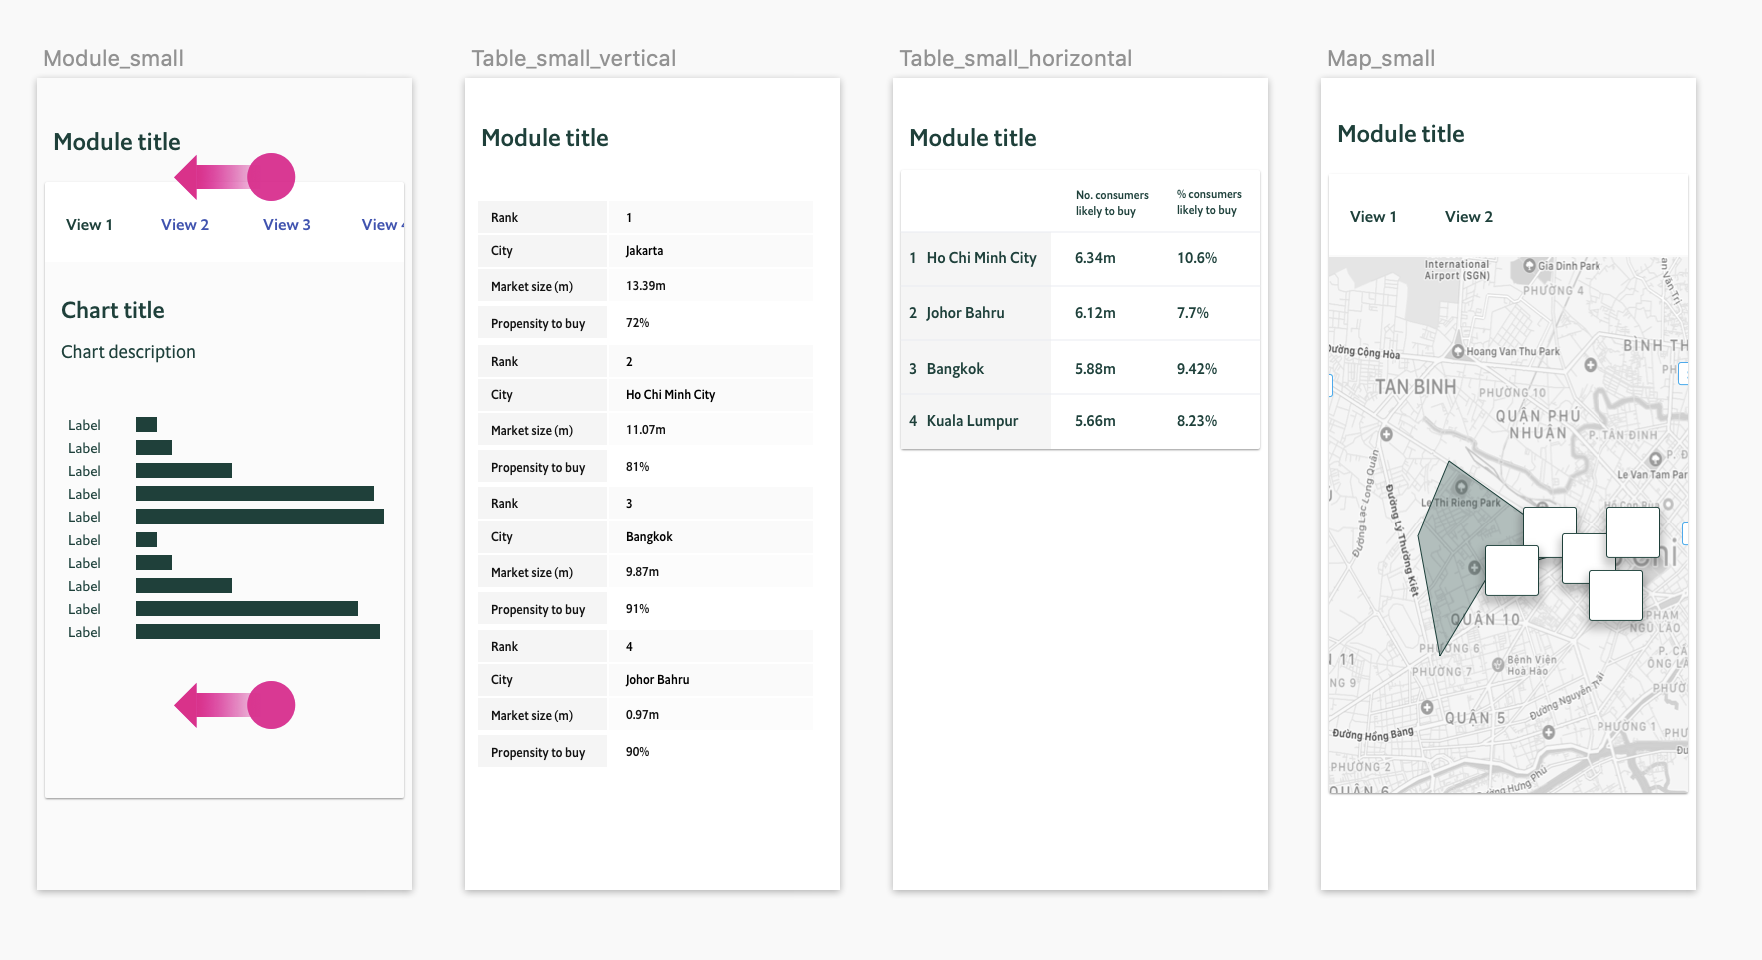
06 Data visualisation design
Once I had a vision for the overall architecture I began to think more closely about the data design for each view, trying to ensure that headline information could be quickly extracted in places, but also allow for data deep dives where needed.
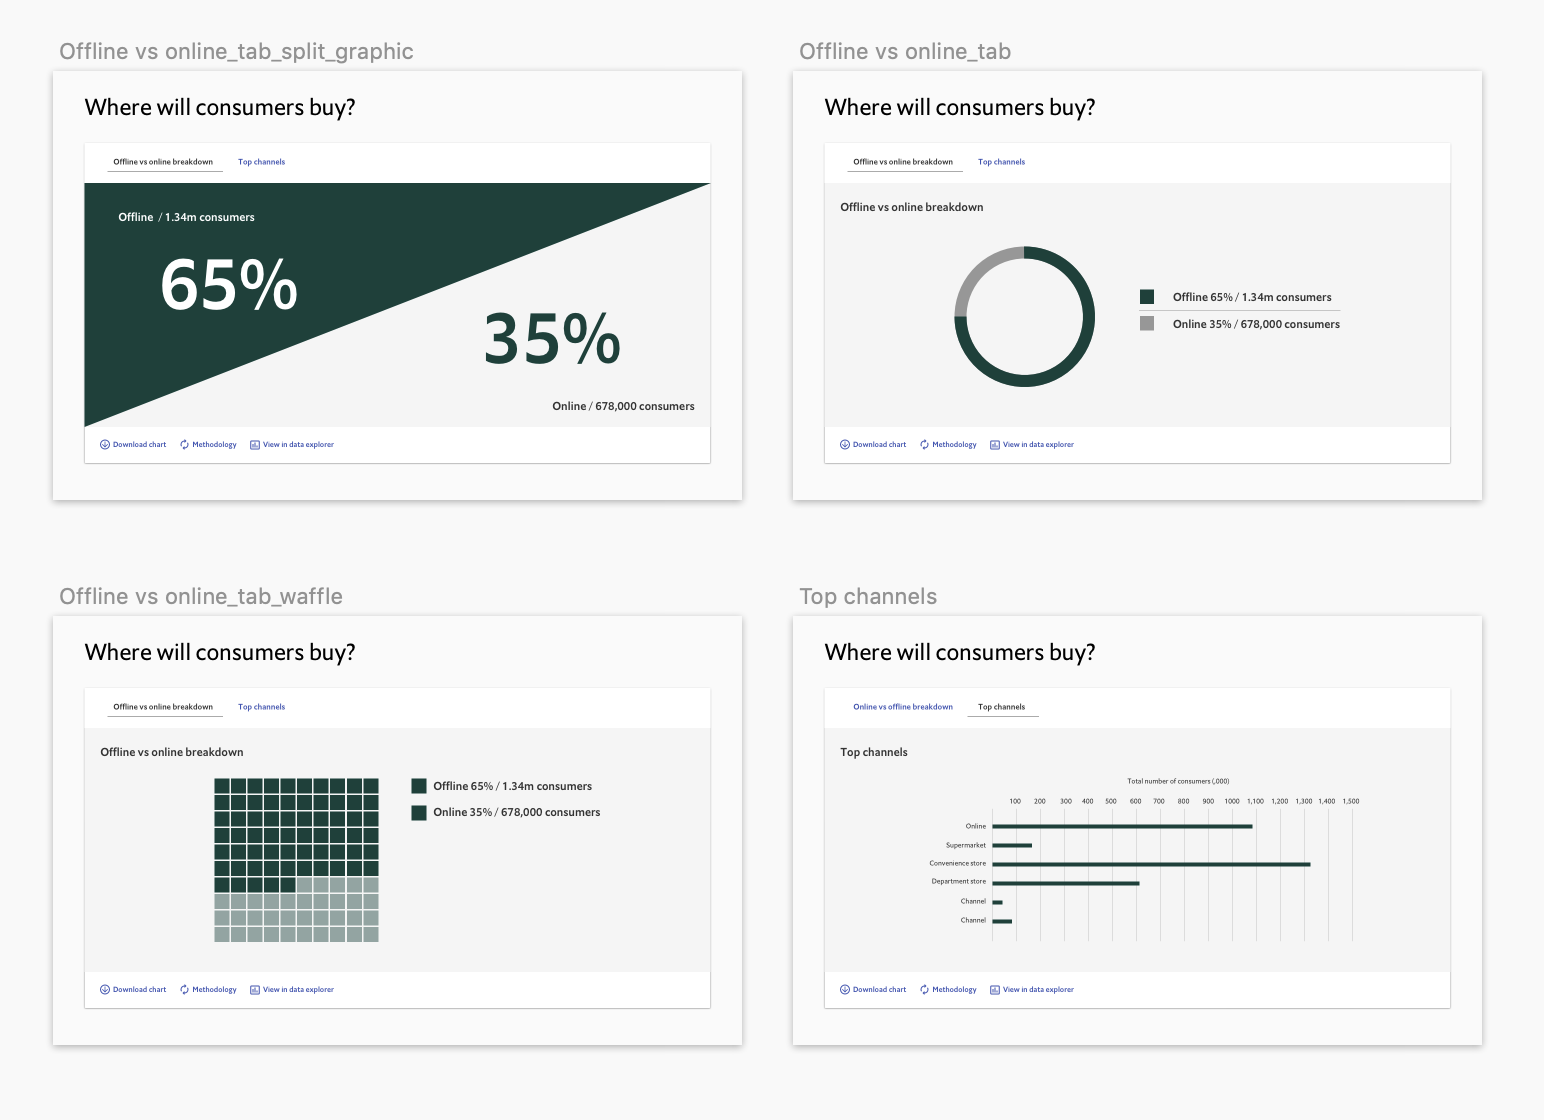


A late request from the EIU’s CEO was to try and incorporate crowd sourced photography into the product, more as a proof of concept for potential ways to source data in the future, than as a core feature or component for the service.
07/ Live data
After surveys and modeling, I tested initial designs with live data. The data team provided an Excel file, which I used for charts in my wireframes. I found data gaps, incorrect assumptions, and unexpected results, working with the team to adjust and remodel. For instance, forecasting propensity to buy wasn’t possible, only market size. Two data sources gave different outputs; Streetbees data included cluster analysis, which I reviewed with analysts and data scientists to visualize properly. Stakeholder feedback led to showing overlapping purpose and frequency data and adding city comparisons. We also included non-chocolate confectionery data. I then created higher-fidelity wireframes and a clickable prototype for one city.


08 / User Testing
We conducted evaluative testing of our full data prototype with two chocolate companies (mass market and luxury). I collaborated with the PM to develop a research plan and session protocol, defining objectives and methods. We co-created session guidelines, and I built a clickable prototype featuring one complete city for user exploration.
Summary of research:
Participants found the data clear, logically organised, and prioritised well. They valued the detailed city data, unique compared to competitors. They saw practical uses in strategic planning, citing the occasion module for product portfolios and holiday breakdowns for yearly business planning. One liked the Explorer module’s interactivity, identifying desired data and tasks. Another valued the Location Intelligence module, especially if real-time product prices could be integrated, currently outsourced by her company. Forecasting was highlighted as an area for improvement; extending forecasts across more indicators and up to 10 years would add strong value, particularly in projecting income group purchasing power. These insights were shared with the data team.

Full data city view
09/ Outcomes
After the final research phase, we held a go/no-go meeting with stakeholders to decide on building a full data proof of concept. Stakeholders were impressed by the detailed data, a notable shift from the usual macro-economic focus. However, concerns about cost, feasibility, and expertise, especially for scaling to other sectors and products, led to pausing the project. We then shifted to strategising in-house capability or partner collaboration for city-level surveys and cluster analysis. Though the project didn’t advance, the team gained valuable insights and provided senior stakeholders with important guidance on the future of data in the business.
We had shown our capability to get to very granular behavioural and attitudinal data at a city level in parts of the world where few of our competitors are doing so.
This project proved to be a catalyst for the EIU to rethink its approach to data with a move away from statistics bureaus and quarterly country level data to real time alternate data sources such as satellite imagery and location intelligence from mobile devices.
We had gone from initial idea through to final modelled data in less than 2 months. The speed of learning was something that we thought had gone well, especially given that the project team was spread across 4 time zones.
Engaging prospective users, especially senior executives in large organisations, was challenging. Early on, we spoke to about 15 organisations but sought better ways to maintain their involvement. We proposed creating an editorial board from prospects to engage them more deeply and gather regular feedback.
A key learning was designing for data before it exists, collaborating with the data team to shape initial visions. We used dummy data and modelling to anticipate outputs. I learned not to fixate on one idea and to consider alternatives when data doesn’t meet expectations.